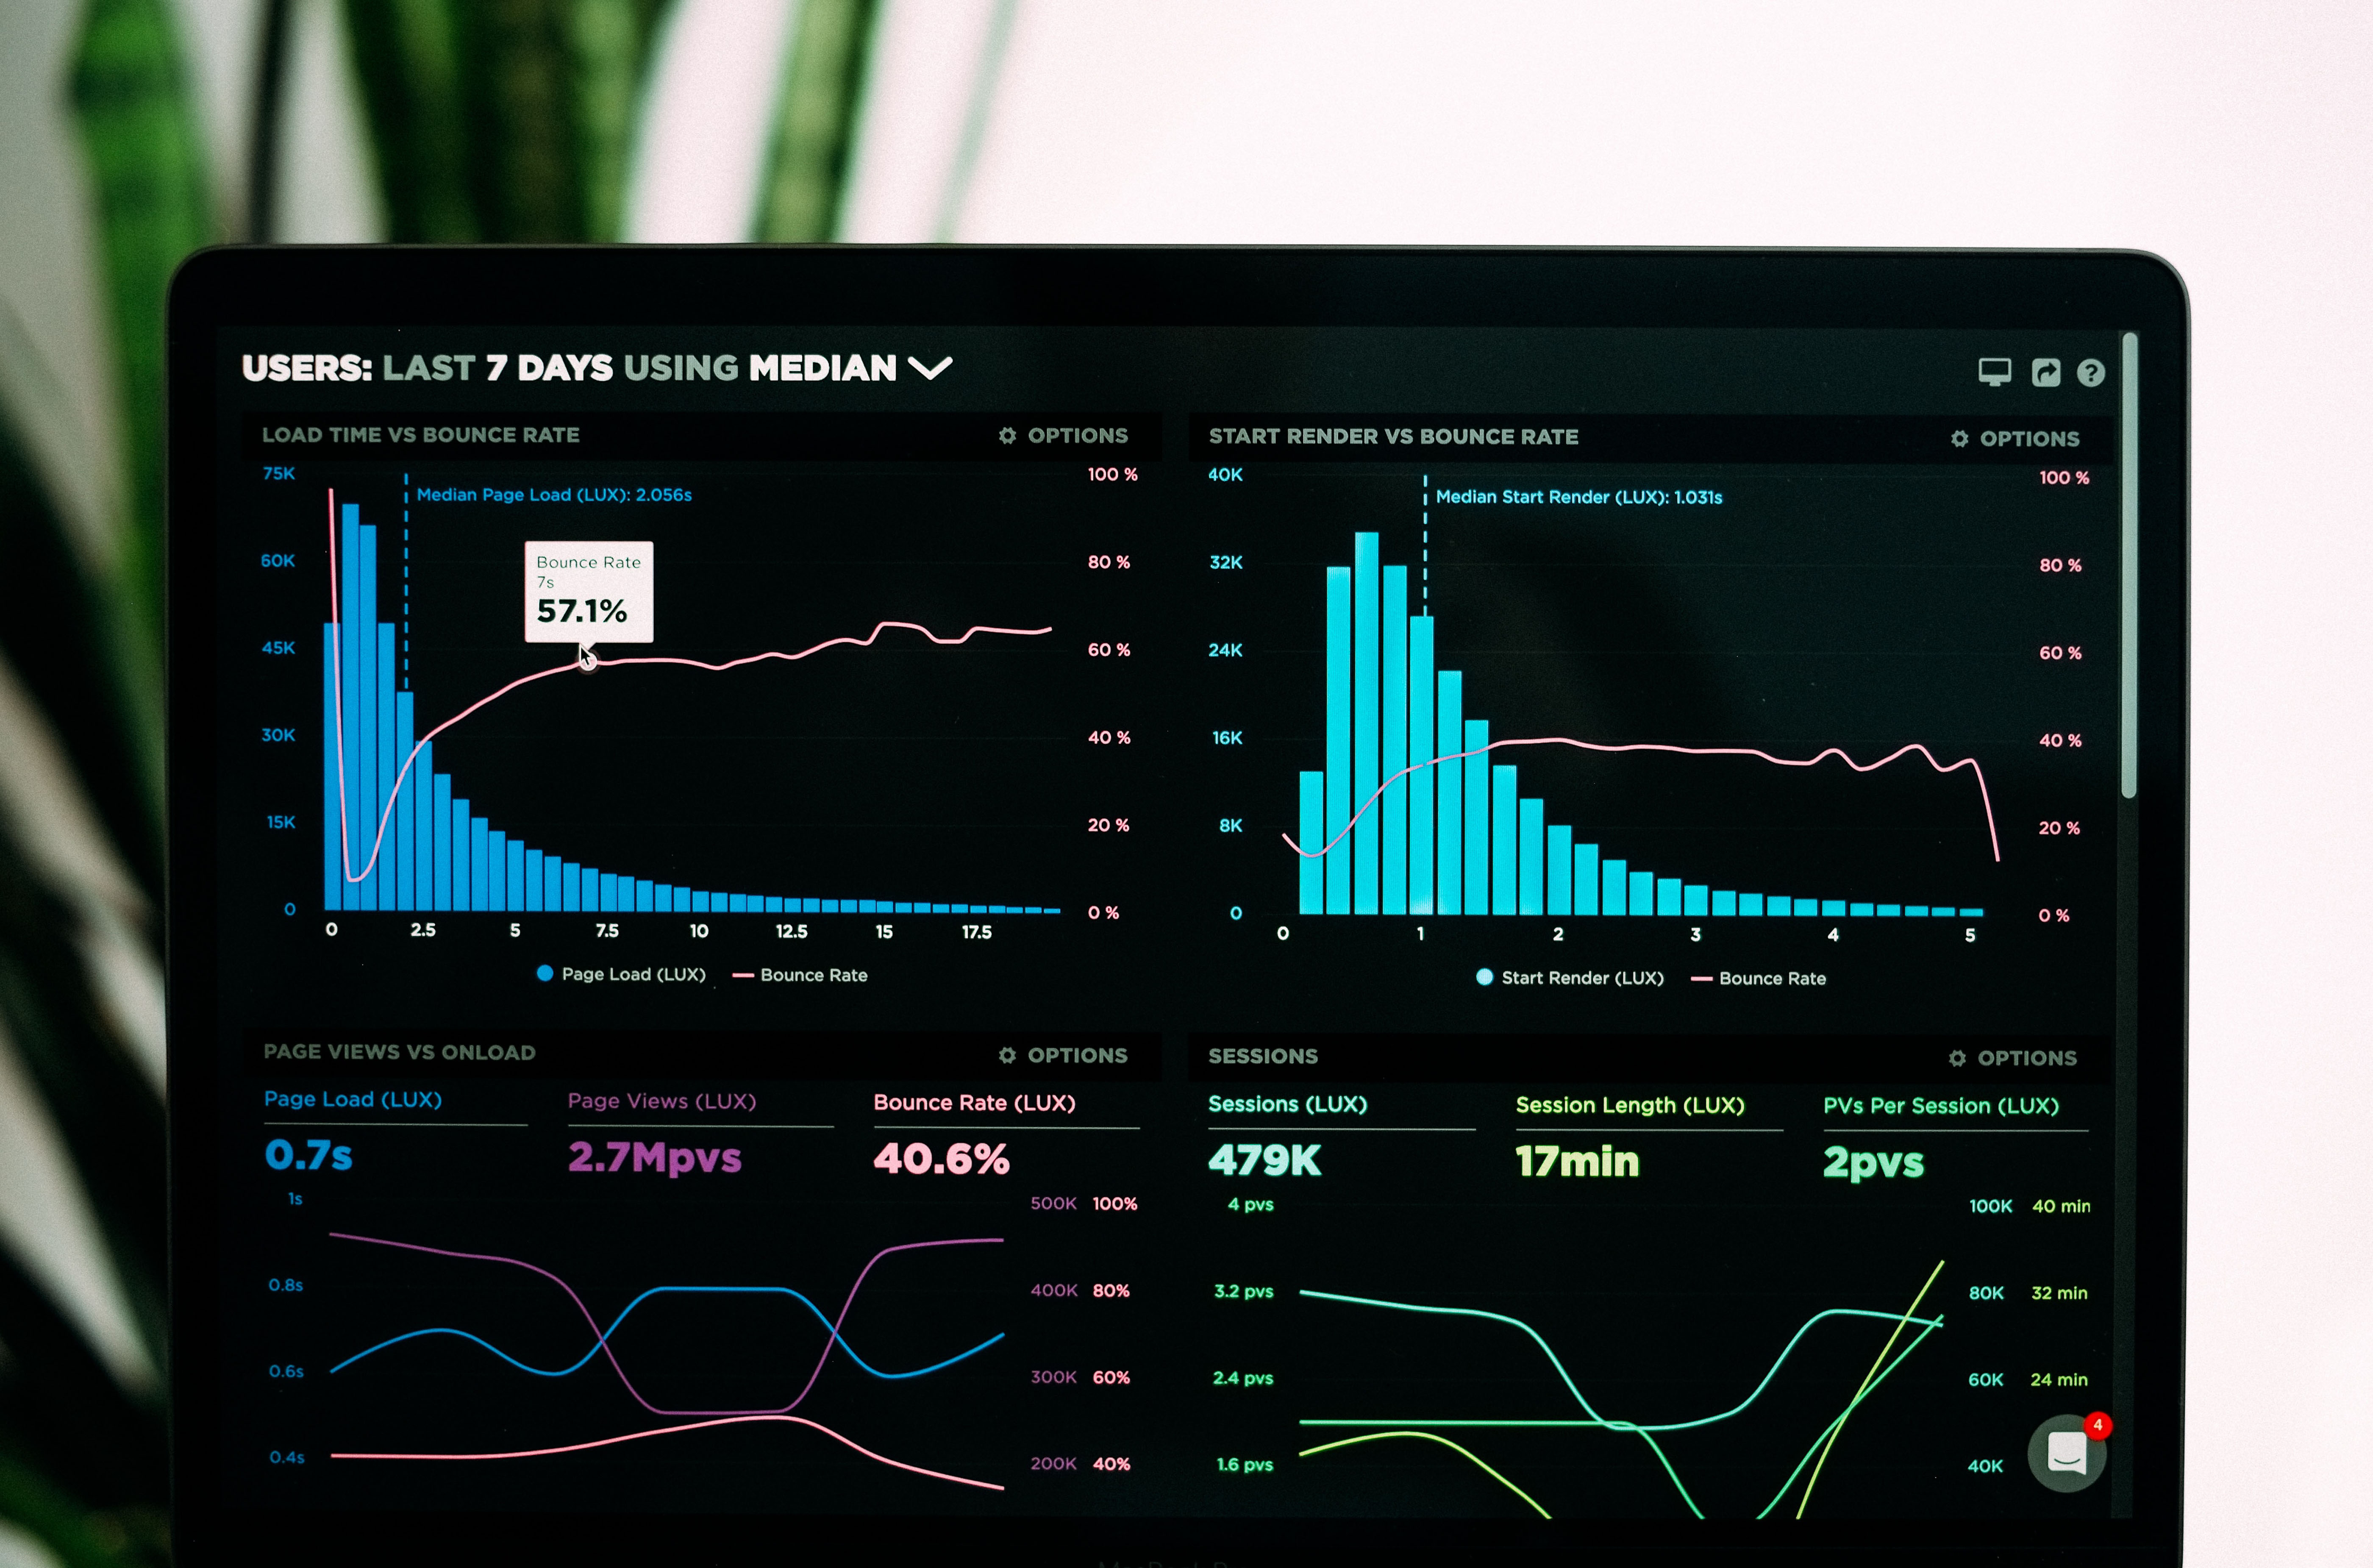
We will take you from basics through advance programming. You have the choice to become a full stack developer or a data scientist or both.
Learn More!This covers data wrangling of various data types. It includes text analytics, various visualisations, ML and DL, and capstone projects.
Learn More!It captures data loading from different sources, transformation including use of DAX and M formula, creating insight through dashboard presentations.
Learn More!This covers different structured query syntaxes, database design, handling of different relationships in database, connecting with python for analytics.
Learn More!At Zippadiva, you will be engaged on a live section with real tutor virtually. The training has two main categories:
This covers the entire module and at the same time involves direct contact with tutor(s) but on an individual basis. Here there is no waiting time for the date of commencement as it depends on the trainee's availability.
Register here.
This involves training in a group. Generally, there is waiting time after registration of a course. The commencement date will usually be communicated to all trainees in the group.
Register here.
Our courses include examples, exercises and real-life application projects. With us, you will build competency that could help you land a job. Our partners recruit most of our trainees. We are also strengthening our partnership and seeking new partners for job placement and collaboration. We educate our current partners while building brand awareness among prospective partners. Zippadiva provides custom Virtual Training that centers around your needs and help you capture more mindshare at all stages. Our tutors are well grounded in their subject areas to give world class experience you deserve.
Python is an interpreted high-level general-purpose programming language. Its design philosophy
emphasizes code readability with its use of significant indentation. Its language constructs as
well as its object-oriented approach aim to help programmers write clear, logical code for small
and large-scale projects. Wikipedia. Register
here.
- Getting Started
- if, elif, else Statements
- Functions
- Numbers
- File Operation
- OOP
- Iterator
- Datetime Module
- Build a BMI calclator using TkinterIntroduction
- Keywords and Identifiers
- Statements and Comments
- Variables
- Datatypes
- Datatype Conversion
- Input, Output and Import
- Operators and Types
- Namespace and Types
- Exercises
Flow Control
- Loops (for Loop, while Loop, etc.)
- break and continue
- Pass
Functions
- Function and Argument
- Recursion in Python
- Anonymous Function
- Global, Local and Nonlocal Variables
- Global Keyword
- Modules
- Package
- Exercises
Datatypes (in details)
- List
- Tuple
- String
- Set
- Dictionary
- Exercises
Files
- Directory
- Exception
- Exception Handling
- User-defined Exception
- Exercises
Object and Class
- Class
- Inheritance
- Multiple Inheritance
- Operator Overloading
- Exercises
Advanced Topics
- Generator
- Closure
- Decorators
- Property
- RegEx
- Exercises
Date & Time
- Datetime and Strftime
- Datetime and Strptime
- Current Date and Time
- Get Current time
- Timestamp to Datetime Conversion
- Time Module
- Time and Sleep
- Exercises
Projects
- Build a Calculator using Tkinter
- Build a car diagnostic scanner
- Sentence Maker Program
- Data analytics and visualisation
Data analytics is the process of analyzing data sets
in order to make the decision about the information they have, increasingly with specialized software
and system. Data analytics technologies are used in commercial industries that allow organizations
to make business decisions. Data can help businesses better understand their customers, improve their
advertising campaigns, personalize their content, and improve their bottom lines. The techniques and
processes of data analytics have been automated into mechanical processes and algorithms that work
over raw data for human consumption. Data analytics help a business optimize its performance.
Data Analytics.
Data visualization is the practice of translating information into a visual context, such as a map or
graph, to make data easier for the human brain to understand and pull insights from. The main goal of
data visualization is to make it easier to identify patterns, trends and outliers in large data sets.
The term is often used interchangeably with others, including information graphics, information visualization
and statistical graphics.
Data visualization is one of the steps of the data science process, which states that after data has been
collected, processed and modeled, it must be visualized for conclusions to be made. Data visualization is
also an element of the broader data presentation architecture (DPA) discipline, which aims to identify,
locate, manipulate, format and deliver data in the most efficient way possible.
Data visualization is important for almost every career. It can be used by teachers to display student
test results, by computer scientists exploring advancements in artificial intelligence (AI) or by executives
looking to share information with stakeholders. It also plays an important role in big data projects. As
businesses accumulated massive collections of data during the early years of the big data trend, they needed
a way to quickly and easily get an overview of their data. Visualization tools were a natural fit.
Visualization is central to advanced analytics for similar reasons. When a data scientist is writing advanced
predictive analytics or machine learning (ML) algorithms, it becomes important to visualize the outputs to
monitor results and ensure that models are performing as intended. This is because visualizations of complex
algorithms are generally easier to interpret than numerical outputs.
Data Visualisation.
Register here.
- Definition
- Using Tokenization
- Numpy
- Python Series
- Data from Zip file
- Charts and Chart Attributes
- Datetime
- Charts and Chart Attributes
- Creating a numpy array from Image
- Capturing Video from webcam
- Interactive Data Visualisation with Python and Bokeh
- Importing Basic Libraries and Packages
- Project 1: Building a web map with python: Interactive mapping with foliumIntroduction
- List
- Set
- Dictionary
- List Comprehension
- Data Types and Sources (csv, json, excel, online, text, etc.)
- Exercises
Text Analytics
- Anagrams
- Exercises
Numbers Analytics
- Generating and Plotting Arbitrary Data
- Exercises
Data Analytics with Series and DataFrame
- Python DataFrame
- Exercises
Connecting to Data from Different File Sources
- Data from Excel
- Data from CSV
- Data from Text
- Data from JSON
- Data from Other Sources
- Exercises
Data Analytics and Visualisation with Matplotlib
- 3D Charts with Matplotlib
- Chart Animation with Matplotlib
- Exercises
Data Analytics and Visualisation with Seaborn
- Exercises
Time Analytics
- Datetime Conversion
- Exercises
Data Analytics and Visualisation with Online Resources
- Exercises
Advance Data Analytics: Image Analytics
- Indexing, Slicing, and Iterating numpy array
- Concatenating and splitting
- Batch Image Resizing
- Detecting Faces in Images
- Capturing Video from webcam
Advance Data Analytics: Video Analytics
- Detecting Moving object from a webcam and record time of entrance and exit
- Storing Object Detection Timestamps in a CSV File and Visualisation
Advance Data Analytics: Visualisation
- Data Visualisation with Justpy
Advance Data Analytics: Machine Learning
- Link to Source Data
- Familiarizing with the Data
- Checking if there are Missing Data
- Data Exploration using Histogram
- Data Exploration using Correlation Matrix
- Creating a Condition for Classification
- Examining Proportion of Data from Classification
- Data for Modelling: Preparation (Standardizing Feature Variables and Data Split)
- Creating Machine Learning (ML) Model and Selection
- Result Presentation and Conclusion
Projects: Advance Optional Project
- Project 2: Detecting Moving object from a webcam and record time of entrance and exit, and making a real-time Visualisation
- Project 3: From Data to Information: E.g. What Day of the Week are People the Happiest?
- Project 4: Interactive Visualisation with Quasar, Highchart and Justpy: Combining Javascript and Python
- Project 5: Interactive Visualisation with Javascript D3.js
- Project 6: Machine Learning Project
- Project 7: Deep Learning Project

Power BI is an interactive data visualization software developed by Microsoft
with primary focus on business intelligence.It is part of the Microsoft Power Platform.
Power BI provides cloud-based BI (business intelligence) services, known as "Power BI Services", along
with a desktop based interface, called "Power BI Desktop". It offers data warehouse capabilities including
data preparation, data discovery and interactive dashboards.In March 2016, Microsoft released an
additional service called Power BI Embedded on its Azure cloud platform. One main differentiator of the
product is the ability to load custom visualizations.
Wikipedia.
Register here.
- Getting started and Set-up
- Connecting to database
- Managing Relationships
- Pie and Treemap
- Create Dashboard
- Project 1Introduction
- Introduction (Power BI)
- Overview of Power BI
- Connecting to 3rd party software (software as services)
- Power BI community.
- Power BI desktop - Changing Locale
Data Transformation
- Data Transformation
- Splitting Columns
- Managing query groups
- Changing data types
- Working with dates
- Removing and Reordering Columns
- Conditional Columns
- Connecting to files in a folder
- Merge queries
- Query dependency view
- Transforming less structured data
- Entering data
- Query Parameters
- Summary
Relationships, DAX and M formula
- Creating calculated columns
- Optimising Models for reporting
- Creating calculated measures
- Creating and managing hierarchies
- Using Calculated Tables
- Time intelligence
- Manually typing in a data table
- Include and exclude
- Grouping Binning
Data Visualisation and Formatting
- Hierarchical Axis and Concatenation
- Filter (including TopN)
- Bar Chart with line
- Analytics pane
- Clustering (machine learning)
- Slicer
- Focus mode and see data
- Date slicer
- Map and filled map
- ESRI Map
- Table and Matrix
- Table Styles
- Scatter Chart
- Water fall chart
- Gauge, Card and KPI
- Colouring Charts
- Shapes, Textboxes and Images
- Gridlines and Snap grids
- Page layout and formatting
- Visual Relationship
- Duplicate Page
- Category with no data
- Default Summarisation and Categorisation
- Positioning, Aligning and Sorting Visuals
Creating Dashboard and Publishing
- Publish Dashboard
Project
- Project 2
- Project 3
- Project 4
SQL, Structured Query Language, is a programming language used by Relational Database
Management Systems (RDBMS) to trigger communication or interaction with the data stored in the database. It aids
analytics by retrieving useful information that promotes informed decision making.
A relational database consists of multiple tables, with rows and columns, that relate to each other. The relationship
between tables is made possible by the addition of a shared columns through a foreign key.
Database design is the organization of data according to a database model. The designer determines what data must be
stored and how the data elements interrelate. With this information, they can begin to fit the data to the database
model. Database management system manages the data accordingly. Database design involves classifying data and identifying
interrelationships. This theoretical representation of the data is called an ontology. The ontology is the theory behind
the database's design.
Wikipedia.
Register here.
- Setup and Installations
- Familiarizing with DBMS
- Intro to: DDL and DML
- Arithmetic Operators
- Introduction - Downloads and Installation
- Introduction to Database DesignIntroduction
- About Data and Database
- Types of Database
- Popular Databases
- Database Selection Criteria
- Database Maintenance
- Database Management
- About SQL and its Subsets
- Database Management System
- Database Terms
- Difference Between SQL and MySQL
- Difference Between MSSQL Server and MySQL
- Differences in Syntax Between SQL Server, MySQL, PostgreSQL and SQLit
Database Overview
- Creating a Database using DBMS
- Importing tables into Database
- Exporting Data
Implementing SQL and T-SQL Queries
- SELECT
- T-SQL Demo
- DISTINCT
- TOP (rows)
- TOP (rows) PERCENT
- AS
- FROM
- WHERE
- AND
- OR
- NOT
- BETWEEN
- LIKE
- IN
- IS NULL
- IS NOT NULL
- CREATE
- DROP
- UPDATE
- DELETE
- AGGREGATE FUNCTIONS (COUNT, SUM, AVG, MIN, MAX, ETC.)
- GROUP BY
- HAVING
- ORDER BY
- DESC
- ASC
- OFFSET
- FETCH
- JOINS (INNER, LEFT, RIGHT, FULL)
- EXISTS
- GRANT
- REVOKE
- SAVEPOINT
- TRUNCATE
- UNION (UNION, UNION ALL)
Operators in SQL
- Comparison Operators
- Logical Operators
- Bitwise Operators
- Compound Operators
SQL and Python Interaction
- Importing Basic Libraries And Connecting to MSSQL Server
- Implementing Query - Visualising SQL Data
- Partway to Analytics and Visualisation - Data Exploration
- Partway to Data Visualisation - Aggregating Data
- Partway to Data Visualisation - Visualising
- Exercises and Assignments
Electives
- Introduction to Data Pipeline (fall)
- Introduction to Data Warehouse (summer)
This course covers a crash course on html, css, and bootstrap. It teaches how to implement
flask frame work in web development. Here flask will be used for backend. Since python is a scripting language,
it will also be used for the frontend. HTML (Hypertext Markup Language) provides the front end architecture while css and bootstrap
provided styling and beautifying of the web application.
.
Register here.
- HTML crash courseOverview
- CSS crash course
- Bootstrap crash course
- Flask overview
- Templates
- Flask forms
- Flask with SQL database
- A web development project
- Project deployment
- Project
This course covers a crash course on html, css, and bootstrap. It teaches how to implement
django frame work in web development. Here django will be used for backend. Since python is a scripting language,
it will also be used for the frontend. HTML (Hypertext Markup Language) provides the front end architecture while css and bootstrap
provided styling and beautifying of the web application.
.
Register here.
- HTML crash courseOverview
- CSS crash course
- Bootstrap crash course
- Django overview
- Templates
- Django forms
- Django with SQL database
- A web development project
- Project deployment
- Project
Basic | Advance | Expert
... Knowledge is power ...